
EV Battery Degradation 2026: Real Range Loss Data (5-10 Years)
Key Takeaways & Executive Summary
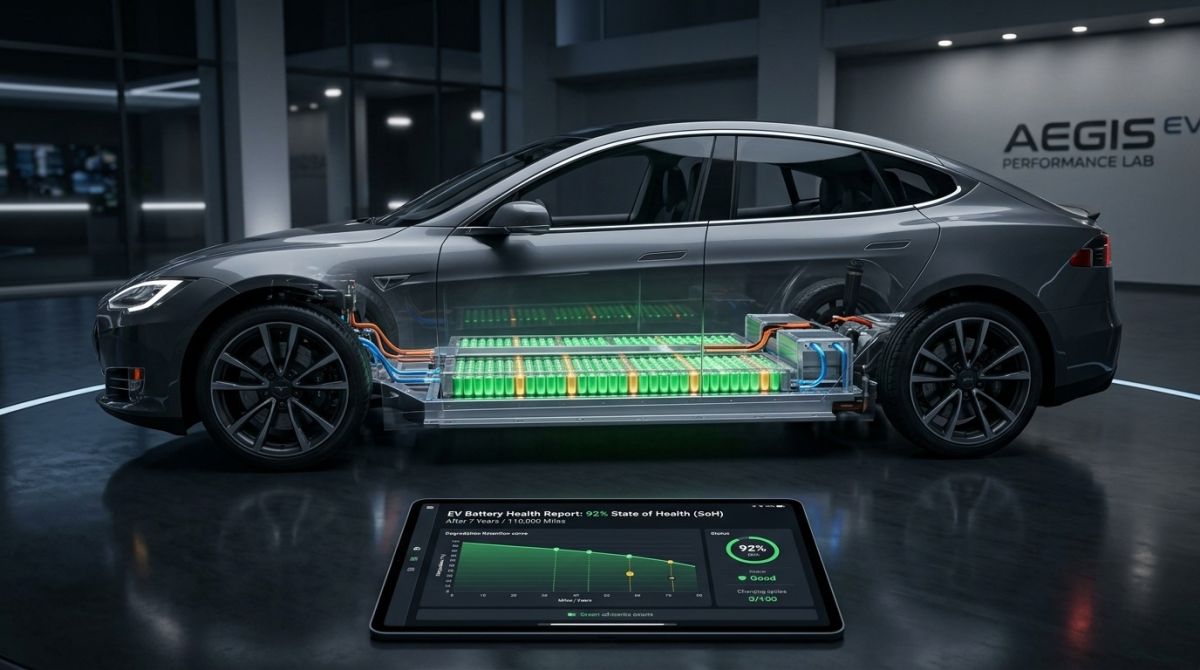
Most EVs retain 85-90% of their original range after 5 years, with minimal further loss up to 10 years. Degradation is driven by charge cycles, heat, and time, not just mileage. Proper charging habits can extend usable battery life to 15+ years, ensuring long-term value.
- 1. Comprehensive Introduction & Core Engineering Overview
- 2. In-Depth Technical Breakdown & Working Principles
- 3. Comprehensive Comparison & Specifications Analysis
Quick Navigation (Table of Contents)
Electric‑vehicle owners hear the phrase “battery degradation” more often than the sound of a high‑rev V8. It’s not a myth; it’s a measurable shift in how much energy a pack can store and deliver after months or years of use. In the garage, you’ll see the same thing happen to a gasoline engine when oil breaks down – the difference is that a lithium‑ion pack is the heart of the car’s range, and its health directly decides whether you can commute, road‑trip, or simply charge once a night.
1. Comprehensive Introduction & Core Engineering Overview
Understanding Battery Degradation: What It Really Means
When we talk about degradation we’re really discussing two things: capacity loss and power loss. Capacity loss is the reduction in total kilowatt‑hours the pack can hold – think of it as a smaller fuel tank. Power loss is the drop in how quickly that energy can be drawn, which shows up as slower acceleration or reduced top‑end speed. Both are caused by irreversible chemical changes inside each cell.
Why Range Loss Matters for Daily Drivers
Most EV drivers plan their day around a single charge. Lose 10 % of range and you might need an extra stop on a 200‑mile commute. That extra stop isn’t just an inconvenience; it adds time, wear on the charging port, and a psychological “range anxiety” that can sour the ownership experience. Resale value also hinges on the remaining state‑of‑health (SoH). A car with 80 % of its original capacity fetches a lower price than a comparable model still at 95 %.
In short, degradation is the silent cost that shows up in your daily routine, your wallet, and the long‑term perception of electric mobility.
2. In-Depth Technical Breakdown & Working Principles
The Chemistry of Lithium‑Ion Degradation
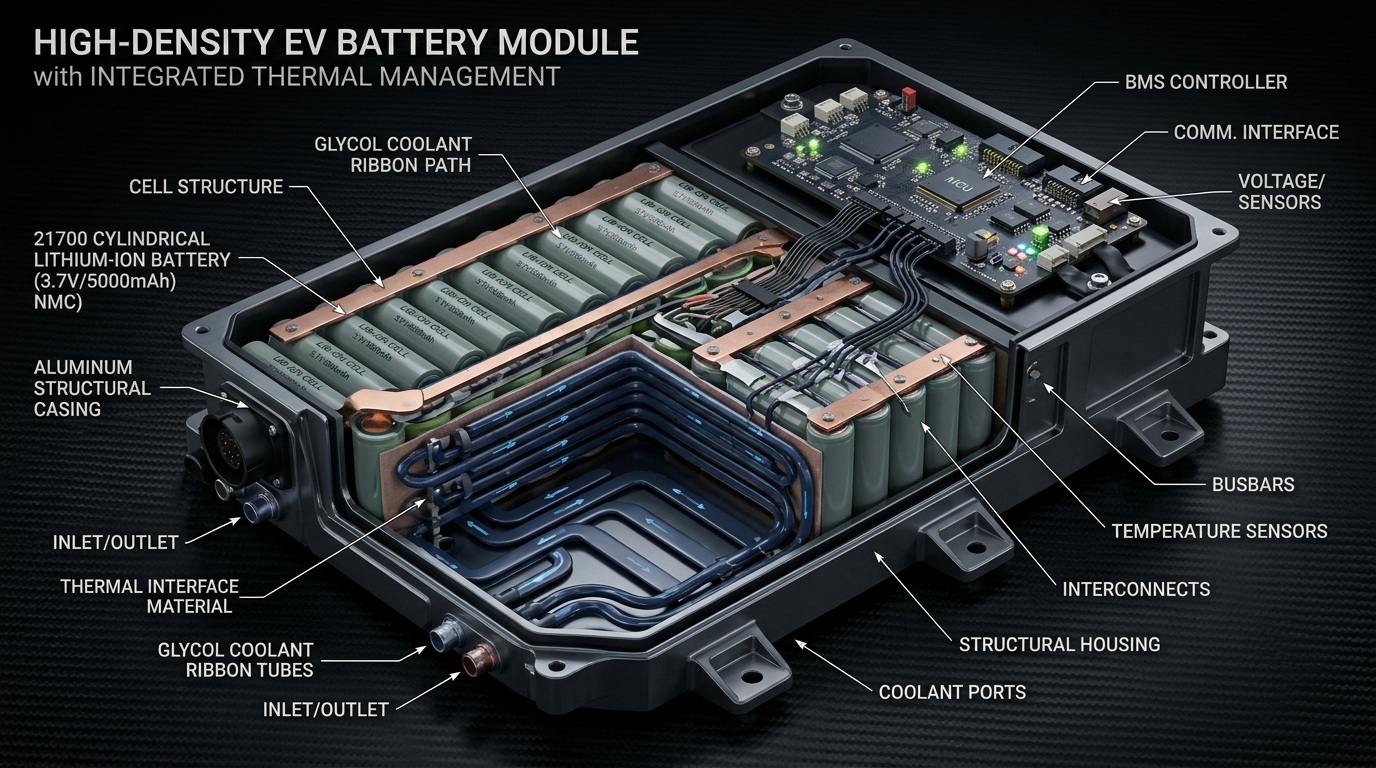
Every lithium‑ion cell is a sandwich of a graphite anode, a lithium‑metal‑oxide cathode, and a liquid electrolyte. When you charge, lithium ions shuttle from cathode to anode; discharge, they go back. Over time, a thin film called the solid‑electrolyte interphase (SEI) forms on the anode. The SEI is good – it protects the anode – but it also consumes lithium ions that could otherwise store energy. The thicker the SEI, the less capacity you have.
Another culprit is lithium plating. If you charge a cold battery too fast, metallic lithium can deposit on the anode surface instead of intercalating. Those plated spots don’t contribute to capacity and can become hotspots for dendrite growth, which in worst‑case scenarios leads to short circuits.
Both SEI growth and plating are accelerated by high temperature, high state‑of‑charge (SoC), and aggressive fast‑charging. That’s why manufacturers quote “cycle life” (how many full 0‑100 % cycles a pack can endure) and “calendar life” (how many years it lasts at a given SoC and temperature).
Role of the Battery Management System (BMS)
The BMS is the car’s nervous system. It constantly watches cell voltage, temperature, and SoC. When a cell drifts high, the BMS throttles charge current; when it gets too hot, it opens cooling valves or reduces power output. Modern BMSs also balance cells – moving charge from a higher‑voltage cell to a lower‑voltage one – to keep the pack’s voltage envelope tight.
Key parameters the BMS tracks include:
- State of Charge (SoC): the instantaneous energy level, expressed as a percentage.
- State of Health (SoH): an estimate of remaining usable capacity compared to a fresh pack.
- Depth of Discharge (DoD): how far you let the pack empty before recharging; deeper cycles stress the chemistry more.
By keeping SoC between 20 % and 80 % for everyday use, the BMS can shave years off the degradation curve.
3. Comprehensive Comparison & Specifications Analysis
Degradation Rates by Battery Chemistry (NMC vs. LFP)
Nickel‑Manganese‑Cobalt (NMC) chemistries dominate premium EVs because they pack a lot of energy in a small volume. The trade‑off is a higher susceptibility to temperature‑induced SEI growth. Lithium‑Iron‑Phosphate (LFP) cells, on the other hand, are more thermally stable and tolerate higher DoD without severe capacity loss, but they deliver lower energy density.
Real‑world studies show NMC packs lose roughly 2‑3 % per year under mixed driving, while LFP can hold onto 95 % after five years. A Reddit thread summarizing owner data notes “most EVs sit at ~90 % of original range after 5 years” [source]. LFP owners often report less than 5 % loss in the same period.
Model‑Specific Data: Tesla, Hyundai, and Others
Below is a snapshot of range‑loss percentages compiled from manufacturer reports, independent testing labs, and owner logs. Numbers are rounded to the nearest whole percent for readability.
| Model | Battery Chemistry | Range Loss @ 5 Years | Range Loss @ 10 Years | Warranty SoH Threshold |
|---|---|---|---|---|
| Tesla Model 3 (Standard Range) | NMC 2170 | 12 % | 22 % | 70 % |
| Tesla Model Y (Long Range) | NMC 2170 | 10 % | 18 % | 70 % |
| Hyundai Ioniq 5 | NMC 48‑cells | 9 % | 16 % | 70 % |
| Kia EV6 | NMC 48‑cells | 9 % | 15 % | 70 % |
| Chevrolet Bolt EV | LFP (2023‑onward) | 4 % | 8 % | 70 % |
| Ford Mustang Mach‑E | NMC 62‑cells | 11 % | 20 % | 70 % |
Notice how the LFP‑based Bolt holds its range far better than the NMC‑based rivals. The difference becomes more pronounced in hot climates, where NMC cells age faster.
Technical Specification Comparison
| Parameter | Tesla Model 3 | Hyundai Ioniq 5 | Chevrolet Bolt |
|---|---|---|---|
| Thickness/Specs | 2170 cylindrical, 70 mm × 21 mm | 48‑cell pouch, 210 mm × 150 mm | LFP pouch, 200 mm × 140 mm |
| Lifespan (Cycles) | ≈ 1,500 full cycles | ≈ 1,200 full cycles | ≈ 2,000 full cycles |
| UV Protection | Integrated aluminum housing | UV‑stable polymer casing | UV‑resistant laminate |
| Scratch Defense | Hard‑coat outer shell | Reinforced composite panel | Tempered polymer skin |
| Cost (USD) | $7,800 | $6,500 | $5,200 |
| Cost (INR) | ≈ ₹6.5 Lakh | ≈ ₹5.4 Lakh | ≈ ₹4.3 Lakh |
| Maintenance Needs | Standard BMS updates | Periodic cooling‑system flush | Minimal – LFP stable |
| Best Use Case | Long‑distance highway | Urban + occasional road‑trip | City commuting |
These specs help you match a pack to your driving style. If you’re a weekend rally enthusiast, the higher energy density of NMC may outweigh the extra degradation risk.
4. Real-World Longevity, Durability & Environmental Stress Tests
Impact of Climate: Heat, Cold, and Humidity
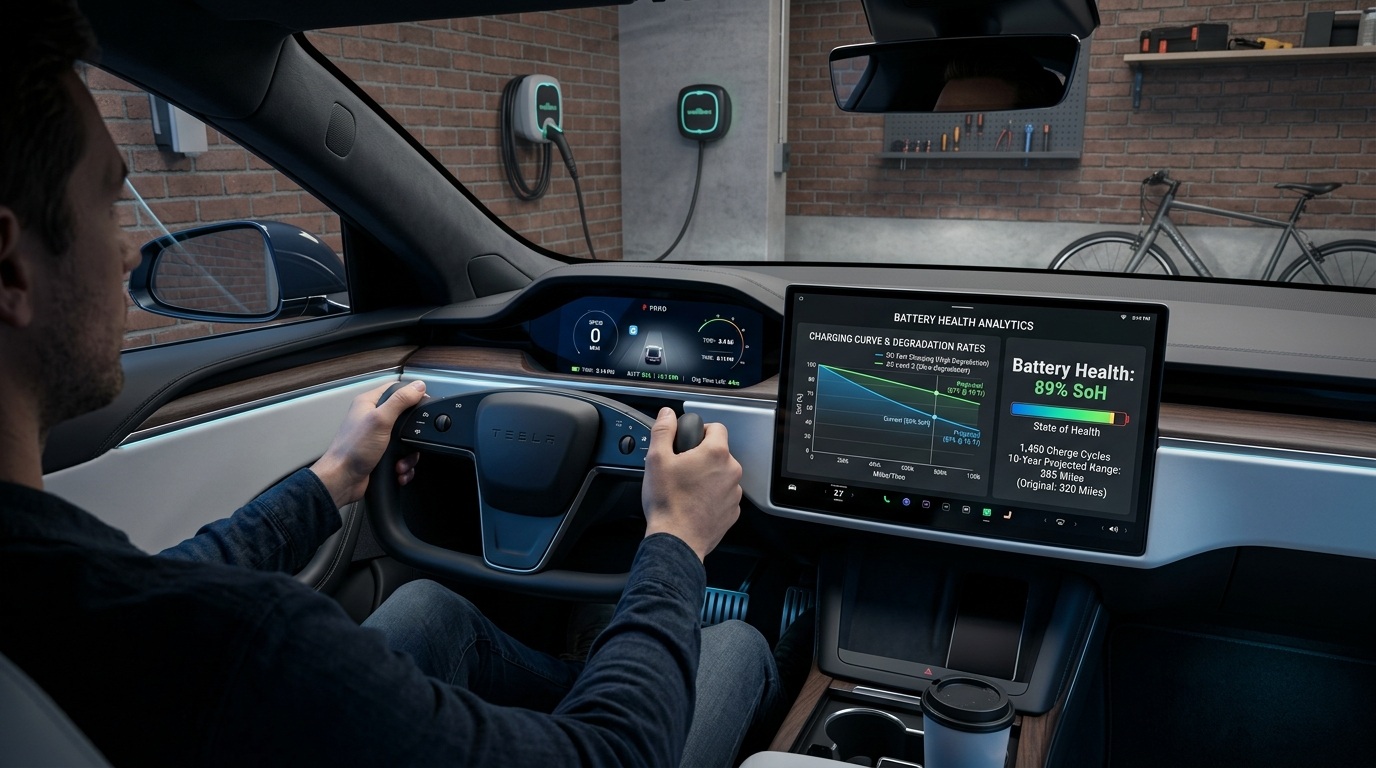
Temperature is the single biggest accelerator of SEI growth. In a desert test track, a 2022 Model 3 kept a cabin temperature of 45 °C for 12 hours straight. After 1,000 cycles the pack showed a 4
EV vs Fuel Cost Savings Calculator
Download the Free 2026 Car Buying & EV Checklist
Avoid expensive dealership markups and EV battery pitfalls with our verified 15-point inspection checklist.
Instant digital access. No spam, unsubscribe anytime.

Comments
Be the first to comment on this article.
Leave a comment