
True Car Ownership Cost 2026: Insurance, Depreciation & Fuel Guide
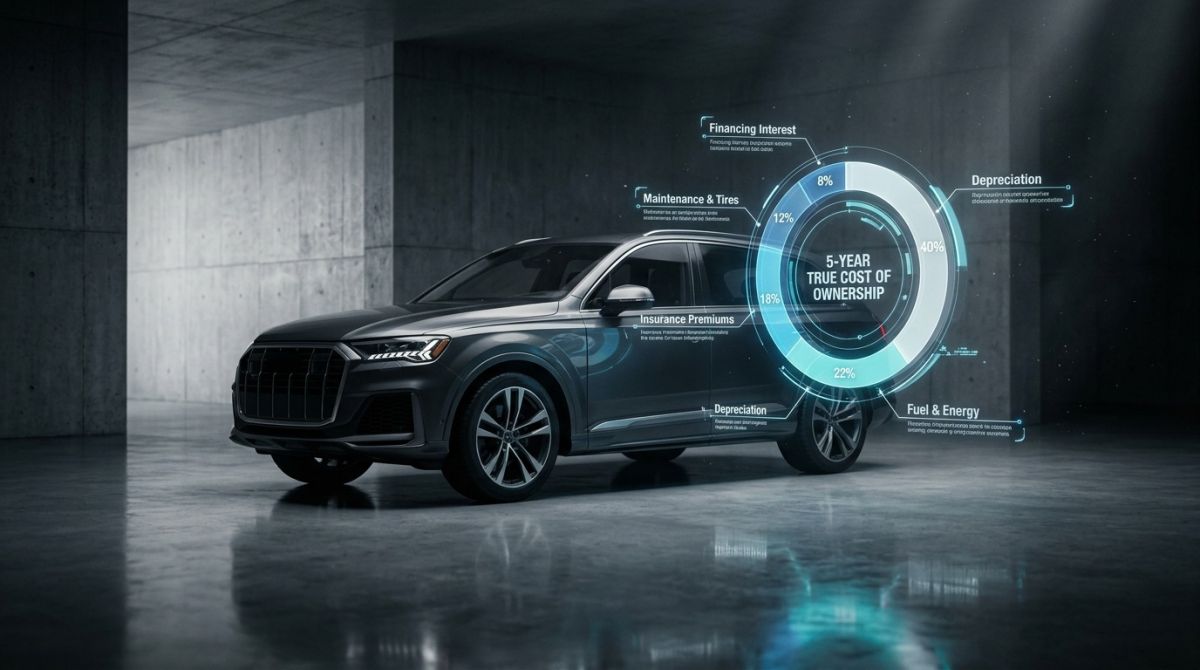
Key Takeaways & Executive Summary
The true cost of car ownership often exceeds the monthly EMI by 30-50% when factoring in insurance, fuel, and maintenance. Depreciation is the largest hidden cost, with vehicles losing up to 20% of their value in the first year. Understanding these variables allows owners to optimize resale value and reduce long-term financial strain significantly.
- 1. Beyond the EMI: Defining the True Cost of Ownership
- 2. Depreciation: The Silent Wealth Erosion
- 3. Insurance: Protecting Your Asset
Quick Navigation (Table of Contents)
When you hand over a cheque for a monthly EMI, the number on the paper looks tidy. Yet, every seasoned driver knows that the real out‑of‑pocket cost is a lot messier. The loan payment is just the tip of an iceberg that hides insurance, depreciation, fuel, and upkeep. Understanding the full picture—what the industry calls Total Cost of Ownership (TCO)—lets you budget with confidence and avoid nasty surprises down the road.
1. Beyond the EMI: Defining the True Cost of Ownership
The Iceberg of Car Expenses
Picture a massive iceberg drifting in the ocean. The visible tip is your monthly EMI, registration fees, and maybe a one‑off down‑payment. Below the surface lie the bulk of the expense: insurance premiums, the inevitable loss of value, the fuel you burn every day, and the routine or unexpected repairs that keep the engine humming. If you ignore the submerged portion, you’ll soon find yourself scrambling for cash when a claim or a major service bill arrives.
Why Monthly Payments Mislead Buyers
Dealerships love to showcase a low EMI because it’s an instant hook. But that figure rarely includes the cost of a comprehensive insurance policy, which can range from 2 % to 5 % of the vehicle’s on‑road price per year. Add depreciation—often 15 % to 20 % in the first 12 months alone—and you’re looking at a hidden expense that dwarfs the loan payment.
- EMI: The scheduled principal + interest payment.
- Insurance: Mandatory protection against loss, theft, and third‑party liability.
- Depreciation: The gradual erosion of market value.
- Fuel/Energy: Variable cost driven by mileage, fuel type, and price volatility.
- Maintenance: Scheduled services, wear‑and‑tear parts, and surprise repairs.
Only by stacking these layers can you calculate a realistic TCO that reflects what you’ll actually spend over the life of the car.
2. Depreciation: The Silent Wealth Erosion
Understanding Depreciation Curves
Every new car starts its life at peak price, but the moment you drive it off the lot the value drops like a stone. The first year typically sees a “cliff” loss of 15 % to 20 %—sometimes even 25 % for high‑volume models. After that, the curve flattens to a steadier 10 %‑12 % per year for the next three to four years, then slows further as the vehicle ages.
Data from Kelley Blue Book shows that compact sedans average a 45 % depreciation over five years, midsize SUVs sit around 50 %, while electric vehicles (EVs) can retain slightly more—about 55 %—thanks of a recent surge in demand and government incentives.
Factors That Accelerate Value Loss
Not all cars lose value at the same rate. Brand reputation matters; a luxury badge can soften the drop, but a scandal‑tainted marque will plunge faster. Color is another hidden factor—neutral shades like white, black, and silver hold resale value better than bold reds or yellows, which appeal to a narrower buyer pool.
Mileage is the most quantifiable driver. The rule of thumb in the industry is a loss of roughly 0.2 % per 1,000 km beyond the “normal” 12,000 km per year benchmark. High‑performance models that encourage spirited driving often accrue mileage and wear faster, further accelerating depreciation.
Market demand swings with fuel prices and regulatory changes. When diesel prices spike, diesel‑powered SUVs see a sharper decline, whereas hybrids and EVs may even appreciate if subsidies remain strong.
A common mistake in the garage is to ignore the impact of mileage on resale value. Even a well‑maintained car can lose 10 % more if it crosses the 150,000 km mark early.
3. Insurance: Protecting Your Asset
Comprehensive vs. Third‑Party Coverage
In most markets, third‑party liability is the legal minimum. It covers damage you cause to other vehicles or property, but leaves your own car exposed to theft, fire, or collision. Comprehensive policies bundle those gaps, adding a layer of protection that many owners consider essential.
Premiums are calculated on a matrix of factors: vehicle age, engine displacement, driver history, and location. A 2022 midsize sedan with a 1.5 L engine in a metropolitan area might attract an annual premium of $1,200 (≈ ₹99,000) for comprehensive coverage, while the same car with only third‑party protection could be as low as $600 (≈ ₹49,500). Drivescope Hub notes that deductibles and add‑ons—like zero‑depreciation or roadside assistance—can swing the premium by another 10 % to 20 %.
How Claims Impact Future Premiums
Filing a claim isn’t just a one‑off expense; it reshapes your risk profile. Insurers typically increase the renewal premium by 15 % to 30 % after a claim, especially if the fault is yours. Conversely, a clean No‑Claim Bonus (NCB) can shave up to 50 % off the base premium after three claim‑free years.
Consider the long‑term arithmetic: paying $1,500 out‑of‑pocket for a minor dent might keep your NCB intact, saving $300 on the next year’s premium. In contrast, filing a claim for the same dent could raise the next renewal by $225, eroding the immediate savings.
| Parameter | Thickness/Specs | Lifespan | UV Protection | Scratch Defense | Cost (USD) | Cost (INR) | Maintenance Needs | Best Use Case |
|---|---|---|---|---|---|---|---|---|
| Standard Glass | 3 mm | 5 years | Low | Low | $45 | ₹3,600 | Minimal | Base model |
| Tempered Glass | 5 mm | 7 years | Medium | Medium | $80 | ₹6,400 | Occasional inspection | Mid‑range sedan |
| Laminated Safety Glass | 6 mm | 10 years | High | High | $120 | ₹9,600 | Annual check | Premium SUV |
| Acoustic Laminated | 6 mm + acoustic layer | 10 years | High | High | $150 | ₹12,000 | Annual check | Luxury sedan |
| UV‑Coated Glass | 5 mm + UV film | 8 years | Very High | Medium | $110 | ₹8,800 | Bi‑annual cleaning | Convertible |
| Self‑Cleaning Glass | 5 mm + nano‑coating | 9 years | High | High | $200 | ₹16,000 | Annual coating renewal | EV hatchback |
4. Fuel & Energy: The Variable Operating Cost
Calculating Real‑World Fuel Efficiency
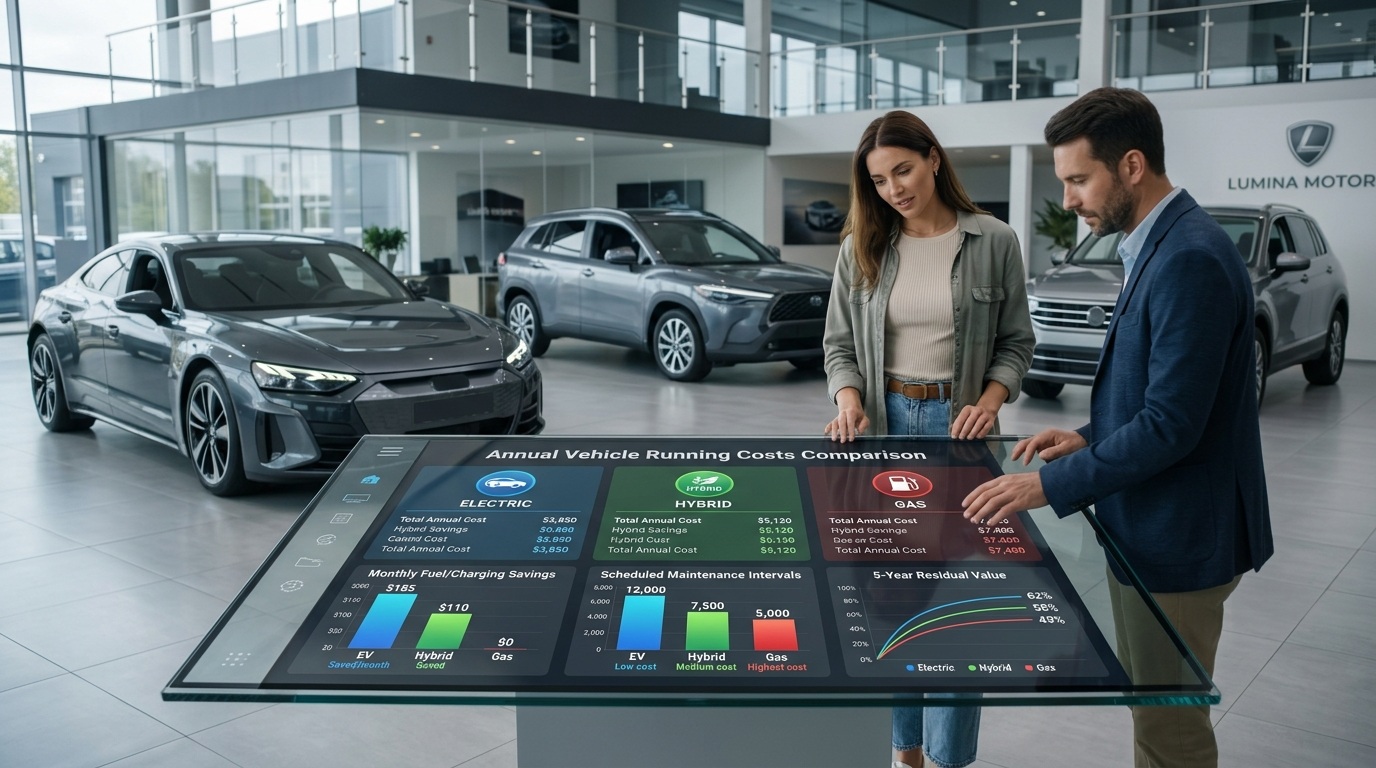
Official fuel‑economy figures are measured under ideal lab conditions. In real life, you’ll see 15 % to 25 % lower numbers because of traffic, load, and driving style. A 7 L/100 km sedan that claims 15 km/L on paper often delivers around 12 km/L on city commutes.
Use this simple formula to estimate monthly fuel spend:
Monthly Fuel Cost = (Average Daily km × 30 ÷ Real‑World km per litre) × Fuel Price per litre
Plug in 45 km daily, a realistic 12 km/L, and a petrol price of $1.30 (≈
EV vs Fuel Cost Savings Calculator
Download the Free 2026 Car Buying & EV Checklist
Avoid expensive dealership markups and EV battery pitfalls with our verified 15-point inspection checklist.
Instant digital access. No spam, unsubscribe anytime.



Comments
Be the first to comment on this article.
Leave a comment